I Built a Magnificent 7 Dashboard in 10 Minutes Using EvidInvest MCP
Screener websites are dying.
If you care about the Magnificent 7 — AAPL, MSFT, GOOGL, AMZN, NVDA, META, TSLA — the old way to compare them looks like this:
- Open 3–5 tabs across different stock sites
- Click your way to P/E, PEG, and growth metrics
- Copy numbers into a spreadsheet
- Manually chart price performance vs fundamentals
With EvidInvest MCP, you can replace that entire workflow with a single dashboard and a few tool calls.
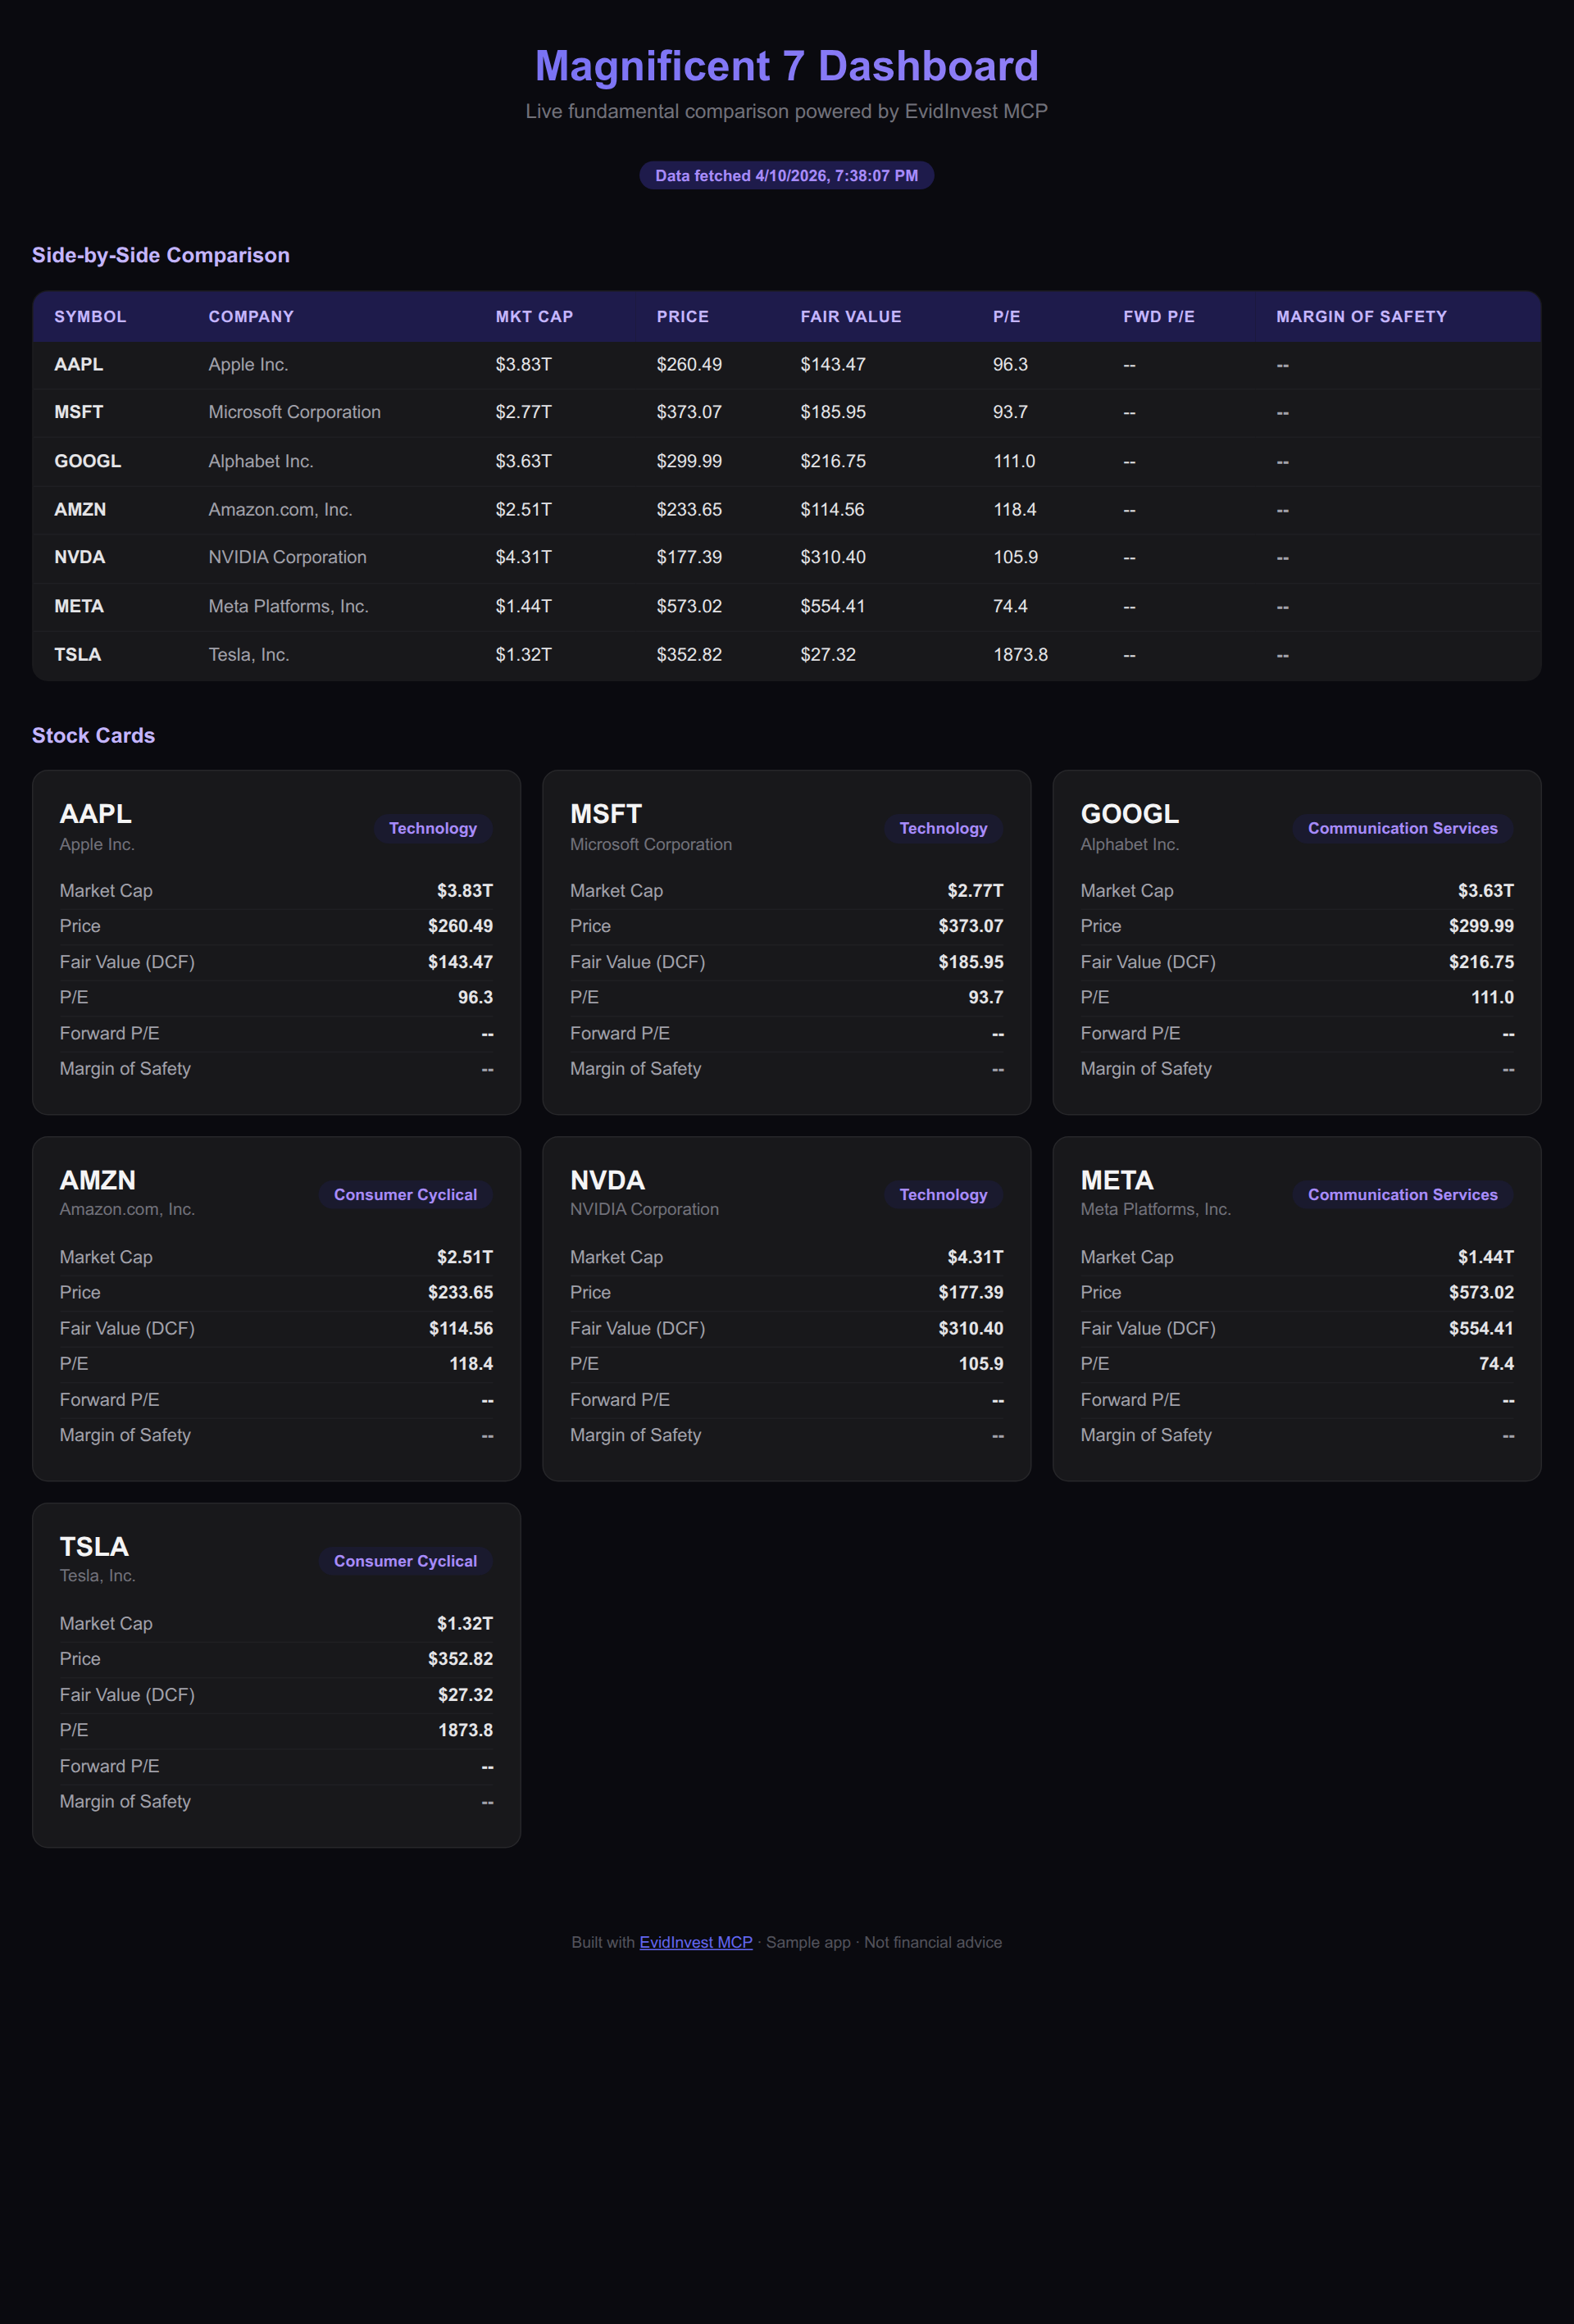
In this post, we'll walk through how to build a simple Mag7 comparison dashboard that shows:
- 1-year price performance for all 7 stocks
- Key fundamentals side-by-side (P/E, PEG, revenue growth, operating margin)
- How fundamentals line up with stock performance
…and we'll do it in a way that anyone can follow, even if you're not a full-time developer.
What we're building
Our dashboard has three main sections:
- Price performance — a chart of 1-year total return for the Magnificent 7.
- Fundamentals table — for each ticker: P/E, PEG, revenue growth, operating margin.
- Takeaways — quick highlights like "which stock has the best margin of safety?" or "which is most expensive vs its growth?"
Under the hood, all of this comes from the EvidInvest MCP server. You don't have to scrape anything or maintain your own data pipeline.
Setting up a fresh Next.js app
If you're comfortable running a couple of commands, you can get a Next.js app up in minutes.
- Create a new app:
npx create-next-app mag7-dashboard
cd mag7-dashboard
- Add whatever HTTP client you like (or use
fetch):
npm install axios
- Get an EvidInvest API key from the developer portal and add it to your
.env.local:
EVIDINVEST_API_KEY=your_api_key_here
We'll treat the MCP server as a backend that exposes tools you can call from the app.
Calling EvidInvest MCP tools for the Magnificent 7
EvidInvest's MCP server exposes tools for valuations and fundamentals. For a Mag7 dashboard, you'll typically need:
- A price history or return tool (e.g.
get_price_performance) - A fundamentals tool (e.g.
get_key_ratios)
Conceptually, your backend route might:
- Accept a list of tickers:
["AAPL", "MSFT", "GOOGL", "AMZN", "NVDA", "META", "TSLA"]. - Call the MCP tools for each ticker.
- Return a combined JSON response to your frontend.
Pseudo-code (simplified for clarity):
// app/api/mag7/route.ts (Next.js App Router style)

import { NextResponse } from 'next/server';

const TICKERS = ["AAPL", "MSFT", "GOOGL", "AMZN", "NVDA", "META", "TSLA"];

export async function GET() {
  const results = await Promise.all(
    TICKERS.map(async (ticker) => {
      const [performance, fundamentals] = await Promise.all([
        callEvidInvestTool('get_price_performance', { ticker, period: '1Y' }),
        callEvidInvestTool('get_key_ratios', { ticker }),
      ]);

      return {
        ticker,
        oneYearReturn: performance.oneYearReturn,
        pe: fundamentals.pe,
        peg: fundamentals.peg,
        revenueGrowth: fundamentals.revenueCagr5y,
        operatingMargin: fundamentals.operatingMargin,
      };
    })
  );

  return NextResponse.json({ results });
}
You don't need to copy this verbatim — the key idea is: one simple API route, powered entirely by EvidInvest MCP, returns everything your dashboard needs.
Building the Mag7 dashboard UI
On the frontend, you fetch from /api/mag7 and render:
- A bar chart for 1-year returns.
- A table for fundamentals.
- A few text takeaways.
In React, that might look like:
'use client';

import { useEffect, useState } from 'react';

export default function Home() {
  const [data, setData] = useState([]);

  useEffect(() => {
    fetch('/api/mag7')
      .then((res) => res.json())
      .then((json) => setData(json.results || []));
  }, []);

  return (
    <main className="max-w-5xl mx-auto py-8">
      <h1 className="text-3xl font-bold mb-4">Magnificent 7 Dashboard</h1>
      <p className="mb-6 text-gray-600">
        1-year performance and fundamentals for AAPL, MSFT, GOOGL, AMZN,
        NVDA, META, and TSLA — powered by EvidInvest MCP.
      </p>

      <section className="mb-8">
        <h2 className="text-xl font-semibold mb-2">1-Year Price Performance</h2>
        <div className="grid grid-cols-7 gap-2 text-center">
          {data.map((row) => (
            <div key={row.ticker}>
              <div className="text-sm font-medium">{row.ticker}</div>
              <div className="text-lg">
                {Math.round(row.oneYearReturn * 100) / 100}%
              </div>
            </div>
          ))}
        </div>
      </section>

      <section>
        <h2 className="text-xl font-semibold mb-2">Fundamentals vs Performance</h2>
        <div className="overflow-x-auto">
          <table className="min-w-full text-sm">
            <thead>
              <tr>
                <th>Ticker</th>
                <th>1Y Return</th>
                <th>P/E</th>
                <th>PEG</th>
                <th>5Y Revenue CAGR</th>
                <th>Operating Margin</th>
              </tr>
            </thead>
            <tbody>
              {data.map((row) => (
                <tr key={row.ticker}>
                  <td>{row.ticker}</td>
                  <td>{Math.round(row.oneYearReturn * 100) / 100}%</td>
                  <td>{row.pe}</td>
                  <td>{row.peg}</td>
                  <td>{row.revenueGrowth}%</td>
                  <td>{row.operatingMargin}%</td>
                </tr>
              ))}
            </tbody>
          </table>
        </div>
      </section>
    </main>
  );
}
Use your preferred styling and charting library. The point is that all the data plumbing is handled by EvidInvest MCP.
Recording a quick demo
Once the dashboard is running locally:
- Start a screen recording.
- Refresh the page to show data loading from
/api/mag7. - Hover over the bars, scroll the table, and call out any interesting contrasts (e.g., high growth but weak operating margins, or value names with strong fundamentals).
- Export a short clip (10–20 seconds) or GIF.
Post it on X with a caption like:
Built this Mag7 dashboard in ~10 minutes using EvidInvest's MCP server. 1-year performance, P/E, PEG, revenue growth, and operating margin for AAPL, MSFT, GOOGL, AMZN, NVDA, META, TSLA — all pulled live. Anyone can build their own dashboards now, not just hedge funds.
Turning it into a Reddit + Claude demo
This same example works perfectly for r/ClaudeAI:
- In Claude Desktop, add the EvidInvest MCP server.
- Start a chat and tell Claude: "Help me scaffold a simple Next.js dashboard that shows 1-year performance and fundamentals (P/E, PEG, revenue growth, operating margin) for AAPL, MSFT, GOOGL, AMZN, NVDA, META, TSLA using the EvidInvest MCP tools."
- Let Claude generate the initial code (API route + frontend skeleton).
- Copy/paste into your project and tweak.
Your Reddit post can then be:
- Title: "I asked Claude to build a Magnificent 7 dashboard with EvidInvest MCP — here's the result"
- Body: screenshots + code snippets + link to EvidInvest dev docs.
This shows non-developers that you can get a dashboard up and running with a mix of Claude + MCP + EvidInvest, without spending days in Excel.
Where to go next
The Magnificent 7 dashboard is just a starting point.
Once you have this pattern working, you can:
- Swap tickers for your own portfolio
- Add EvidInvest fair value + margin of safety labels
- Build alerts when a stock moves too far above/below intrinsic value
- Combine this with the MPT portfolio optimizer to see how adding or removing a stock changes risk/return
EvidInvest MCP turns your AI tools into institutional-grade valuation terminals. If you build something interesting, share it — we'd love to see what dashboards you create.
Fair Value Weekly
Get DCF breakdowns, fair value updates, and portfolio ideas for serious investors. No spam, no paywalled teasers.