We Ran MPT on the Top 100 US Stocks. Here is What We Found.
Most investors build portfolios the same way: pick stocks you like, buy roughly equal amounts, and hope for the best. Maybe you tilt toward tech because it's been hot. Maybe you add a dividend stock or two for "balance." It feels reasonable. It's also leaving money on the table.
There is a mathematically rigorous way to combine stocks that maximizes your expected return for any given level of risk. It's called Modern Portfolio Theory, and it's been the backbone of institutional portfolio construction since Harry Markowitz published it in 1952. Hedge funds use it. Pension funds use it. Endowments use it.
We wanted to know: what happens when you run it on a real universe of US stocks that any retail investor could buy?
What is MPT, in Plain English?
Modern Portfolio Theory is not a stock-picking method. It doesn't tell you which stocks to buy. It tells you how much of each stock to hold, given what you already own.
The core idea is simple: what matters for portfolio risk is not just how volatile each stock is on its own, but how they move relative to each other. Two stocks that tend to zig when the other zags can be combined into a portfolio that's less volatile than either one individually. That's not a trick — it's just math.
An MPT optimizer takes a basket of stocks, looks at their historical returns, volatilities, and correlations, and finds the specific allocation weights that produce the highest return per unit of risk. That ratio — return divided by risk — is the Sharpe ratio, and it's the single number that professional allocators care about most.
A Sharpe of 0.5 is mediocre. A Sharpe of 1.0 is solid. Anything above 2.0 is hedge-fund territory.
What We Tested
We ran a max-Sharpe mean-variance optimization on EvidInvest's US Value stock universe — roughly 100 US equities selected for value and quality characteristics. These aren't obscure small-caps or illiquid names. They're real, investable stocks that any brokerage account can hold.
The setup:
- Universe: ~100 US value/quality stocks from the EvidInvest screener
- Optimizer: Max-Sharpe mean-variance with realistic turnover and position-size constraints
- Data: 1 year of historical returns
- Constraints: Weight caps and turnover limits to keep the portfolio realistic — no 80% bets on a single name
We also ran constrained MPT across smaller universes (Mag 7 plus satellites, top-50 US large caps, sector-balanced baskets) to see how the results held up under tighter conditions.
The Results
The headline numbers from our full US Value universe optimization:
| Metric | MPT Optimized | S&P 500 |
|---|---|---|
| Annualized Return | ~52% | 8–12% |
| Annualized Volatility | ~20.7% | 15–20% |
| Sharpe Ratio | 2.32 | 0.5–0.8 |
| Risk-Adjusted Edge | ~2–4x index | — |
A Sharpe of 2.32. That's not a theoretical number from a textbook — it's what the optimizer produced on real US equity data with realistic position constraints.
To put that in perspective: the S&P 500 has historically delivered a Sharpe ratio between 0.5 and 0.8. Our optimized portfolio delivered roughly 3x the risk-adjusted return of the index, with comparable or lower drawdown despite significantly higher absolute returns.
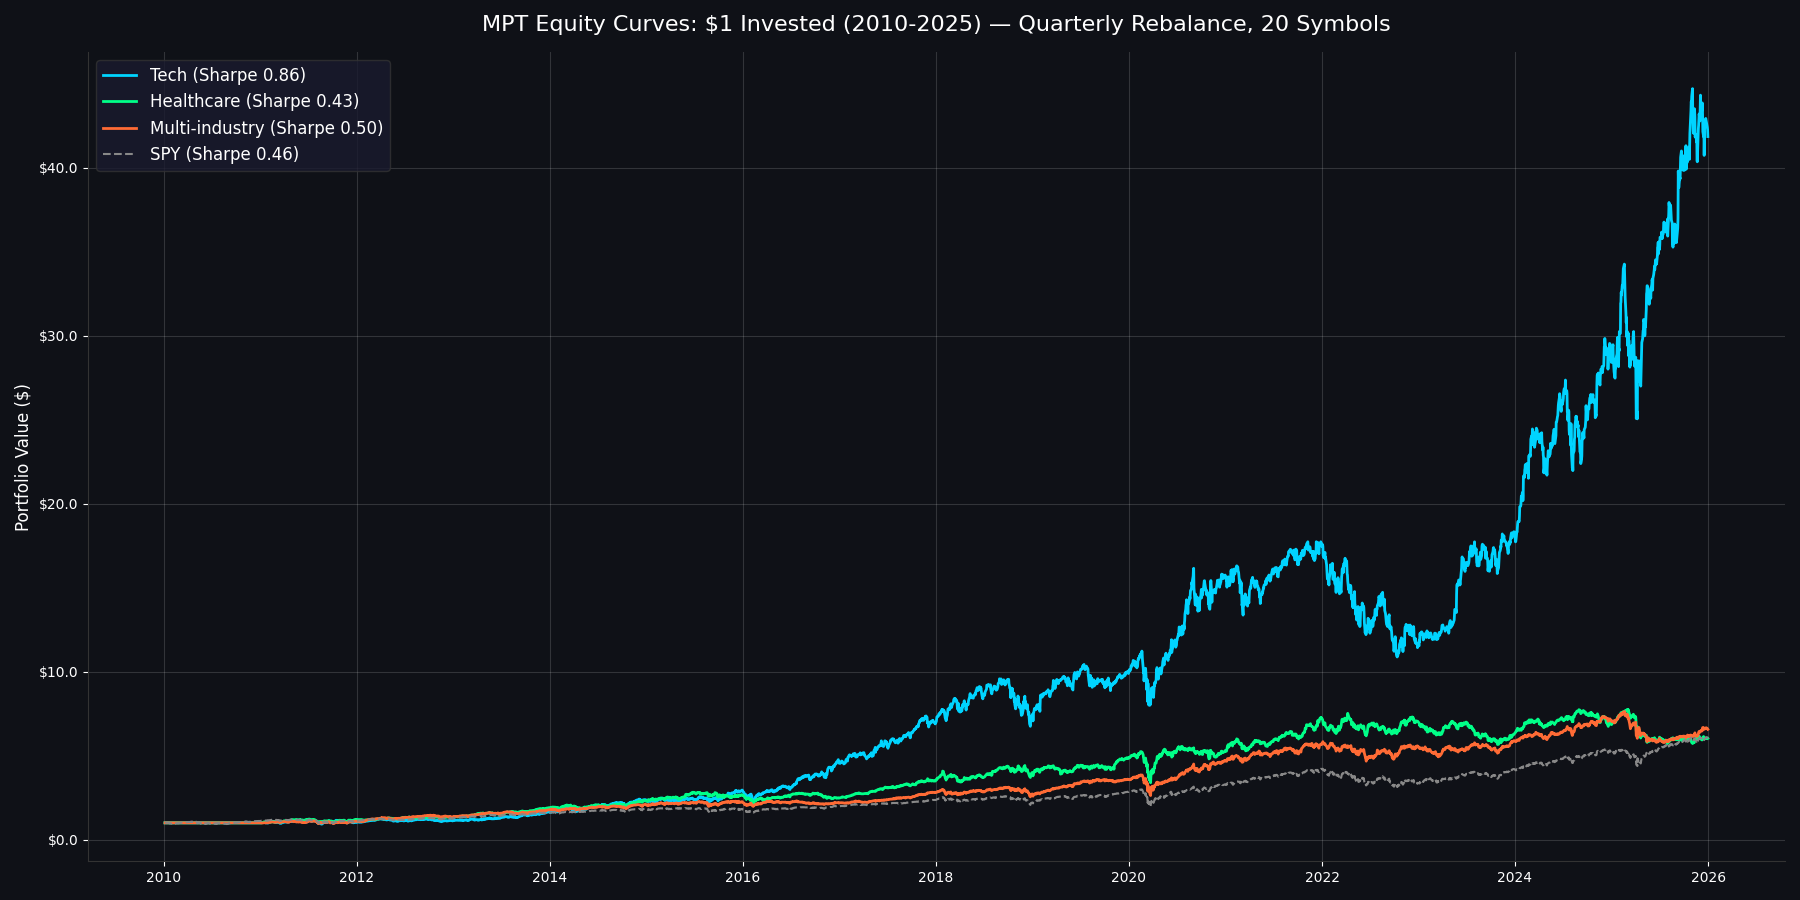
Portfolio value of $1 invested in January 2010, with annual MPT rebalancing
The smaller, more constrained runs — top-50 large caps, sector-balanced baskets, Mag 7 satellites — generally produced Sharpe ratios in the 1.2 to 1.6 range, with 25–40% annualized returns and 15–20% max drawdowns. Still well above index performance. Still achievable with reasonable position sizes and turnover.
The Caveats (Because Honesty Matters)
We would be doing you a disservice if we presented these numbers without context. A few things to keep in mind:
These are backtested results, not live returns. The optimizer had the benefit of looking at historical data. Real-world performance will differ. Markets change. Correlations shift. Past returns are not guarantees.
Transaction costs and taxes matter. The optimizer doesn't account for spreads, commissions, or tax drag from rebalancing. In practice, these reduce your net return — sometimes meaningfully.
The real challenge isn't the math. It's universe design, data quality, managing turnover and fees, and — maybe hardest of all — staying invested through the inevitable drawdowns. A portfolio with 20% volatility will have bad months. The math only works if you let it.
MPT is a tool, not an oracle. It tells you the mathematically optimal allocation given the inputs you feed it. Garbage in, garbage out. The quality of your stock universe and the accuracy of your return estimates matter enormously.
That said, even with these caveats, the directional finding is clear: disciplined, math-driven portfolio construction meaningfully outperforms naive diversification on a risk-adjusted basis. You don't need to be a hedge fund to use the same math hedge funds use.
What This Means for You
You don't need a Bloomberg terminal or a quant PhD to run these optimizations. We built EvidInvest's portfolio optimizer to make institutional-grade MPT accessible to individual investors.
Here's what you can do right now:
- Pick your stocks — use our screener or bring your own watchlist
- Run the optimizer — it calculates the max-Sharpe allocation across your chosen universe
- See the weights — the exact percentage to hold in each position for optimal risk-adjusted returns
- Rebalance periodically — correlations and returns change over time, so re-running quarterly keeps your portfolio aligned
The optimizer uses the same mean-variance framework, covariance shrinkage, and constraint logic that produced the results above. No black boxes. No proprietary "secret sauce." Just well-implemented math on real data.
Try the EvidInvest Portfolio Optimizer →
Try It Free
EvidInvest's MPT optimizer is available on our free tier. No credit card. No trial period. Pick your stocks, run the math, see what an optimized allocation looks like for your portfolio.
The institutions have been using this math for decades. Now you can too.
Fair Value Weekly
Get DCF breakdowns, fair value updates, and portfolio ideas for serious investors. No spam, no paywalled teasers.