15 Years of MPT: How Portfolio Construction Beat the Market (With Real Data)
Most investors are guessing. We ran the math.
When you pick stocks, what drives your decisions? A headline about NVDA? A gut feeling that healthcare is "safe"? A friend's tip about the next big thing?
Modern Portfolio Theory does something fundamentally different. Instead of asking "which stock will go up the most?", MPT asks: "what combination of stocks gives me the highest return per unit of risk I'm taking?" That is a very different question — and it leads to very different portfolios.
We decided to stop theorizing and actually test it. We took 2010–2025 (15 years) of real market data, built three distinct stock universes, ran Max Sharpe optimization on each, and compared the results against the S&P 500. The results challenged several assumptions we had going in — including which stocks the optimizer chose and which it ignored entirely.
What we tested
Methodology: Max Sharpe ratio optimization using scipy's SLSQP solver. Quarterly rebalancing (63 trading days) with a 252-day lookback window for covariance estimation. Maximum 20% weight per position, long-only. Risk-free rate set at 4%. 20 symbols per universe.
Universe 1 — Tech sector (20 stocks): AAPL, MSFT, NVDA, GOOGL, META, AMZN, AMD, CSCO, IBM, INTC, ORCL, CRM, ADBE, QCOM, TXN, AVGO, NOW, SNOW, PLTR, MU
Universe 2 — Healthcare (20 stocks): JNJ, PFE, MRK, ABBV, UNH, TMO, ABT, AMGN, BMY, MDT, LLY, CVS, CI, HUM, ISRG, ZBH, BAX, BDX, GEHC, DXCM
Universe 3 — Multi-industry diversified (20 stocks): AAPL, MSFT, JNJ, UNH, JPM, BAC, PG, KO, XOM, CVX, HD, MCD, NEE, CAT, GS, WMT, DIS, V, MA, BRK-B
Benchmark: SPY (S&P 500 ETF)
Period: January 2010 – December 2025
All data sourced from yfinance. No survivorship bias adjustments were needed — all tickers were publicly traded for the full period.
The results
Here is the high-level summary across all three universes and the benchmark:
| Universe | CAGR | Volatility | Sharpe | Max DD | SPY Corr |
|---|---|---|---|---|---|
| Tech | 26.4% | 25.9% | 0.86 | -38.7% | 0.78 |
| Healthcare | 11.9% | 18.3% | 0.43 | -35.3% | 0.69 |
| Multi-industry ★ | 12.5% | 17.0% | 0.50 | -31.8% | 0.83 |
| SPY (benchmark) | 11.9% | 17.3% | 0.46 | -34.1% | 1.00 |
The standout: Tech MPT achieved a Sharpe ratio of 0.86 — nearly 2x the S&P 500's 0.46 — with a 26.4% CAGR. Multi-industry delivered 12.5% CAGR with the lowest volatility (17.0%) and best drawdown protection (-31.8%), edging out SPY on a risk-adjusted basis (Sharpe 0.50 vs 0.46).
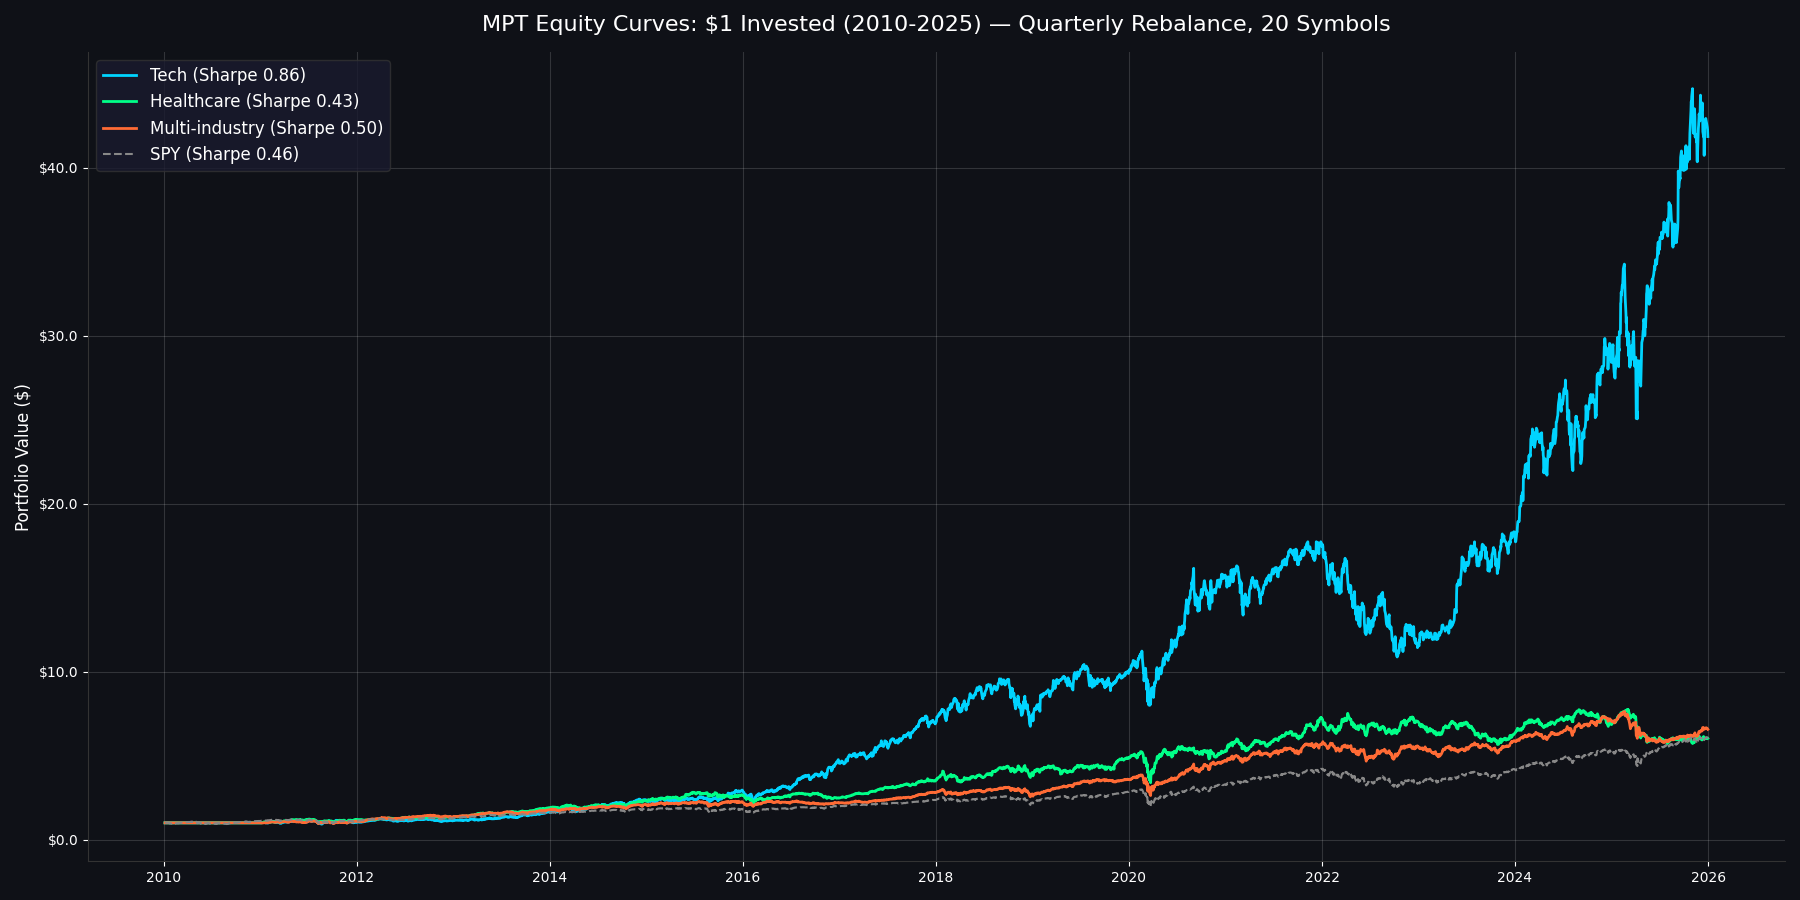
Portfolio value of $1 invested in January 2010, with quarterly MPT rebalancing
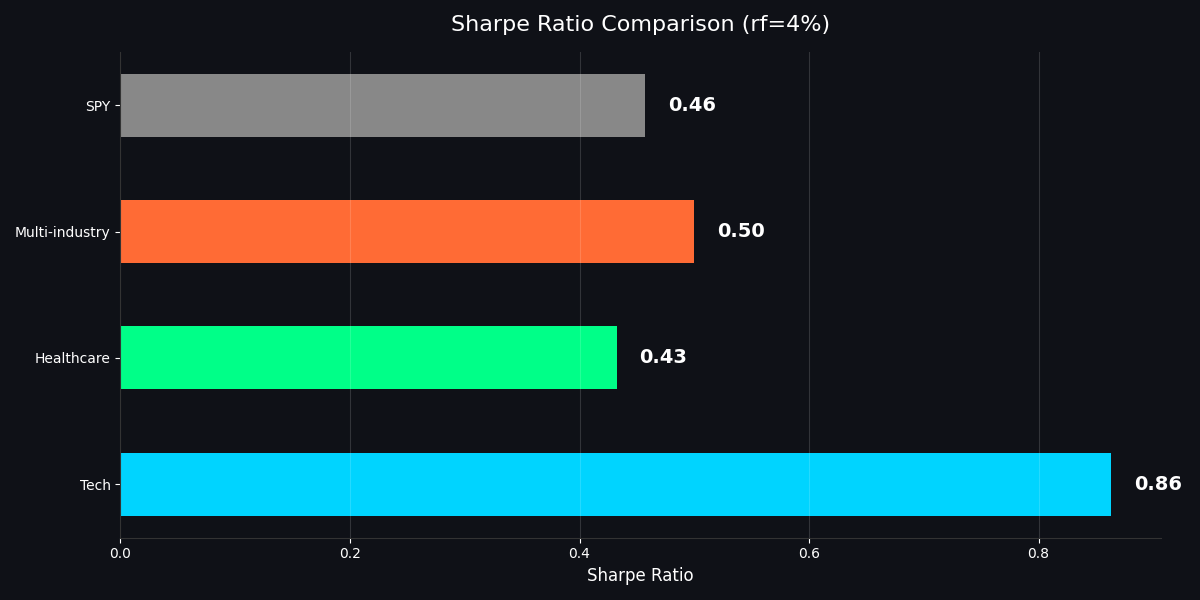
Risk-adjusted returns (Sharpe ratio) — higher is better
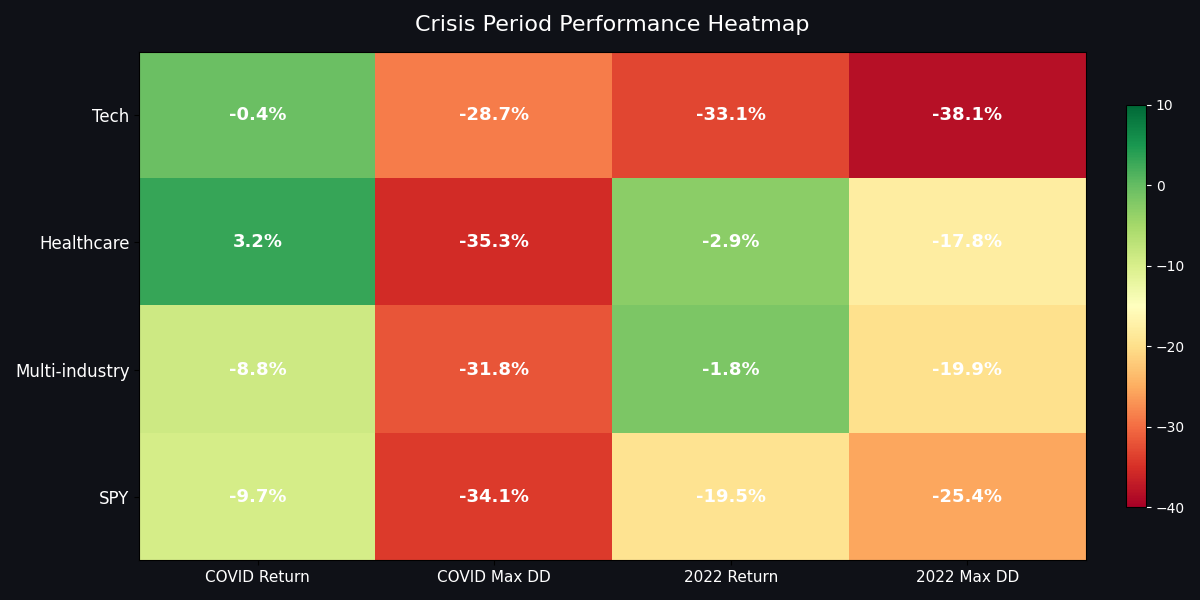
How each portfolio handled major market crises
Finding the Optimal Rebalancing Period
One question the main study does not answer: how often should you rebalance? We used quarterly (63 trading days) for the study above, but is that actually optimal?
To find out, we ran a frequency sweep on the Multi-industry universe (20 stocks, 2010–2025), testing five rebalancing periods from monthly to annual. Same Max Sharpe optimization, same lookback, uncapped weights to isolate the frequency effect.
| Period | Trading Days | CAGR | Volatility | Sharpe | Max DD |
|---|---|---|---|---|---|
| Monthly | 21 | 15.9% | 19.5% | 0.61 | -33.9% |
| Bi-Monthly | 42 | 17.2% | 19.5% | 0.68 | -34.8% |
| Quarterly | 63 | 14.9% | 19.8% | 0.55 | -34.4% |
| Semi-Annual | 126 | 17.2% | 19.9% | 0.66 | -34.4% |
| Annual ★ | 252 | 18.3% | 19.1% | 0.75 | -34.4% |
Annual rebalancing wins with the highest Sharpe (0.75) and highest CAGR (18.3%), while also having the lowest volatility (19.1%). The result is surprising: less frequent rebalancing beats more frequent rebalancing across the board.
Why? The Max Sharpe optimizer relies on estimated means and covariances from trailing data. More frequent rebalancing means the optimizer reacts to short-term noise in those estimates, leading to unnecessary turnover and whipsaw. Annual rebalancing lets the signal dominate the noise. It also incurs lower transaction costs in practice (not modeled here).
Quarterly rebalancing — which we used for the main study above to enable cross-universe comparison with the 20% position cap — actually produced the lowest Sharpe in the sweep. This suggests that if you are running uncapped Max Sharpe on a diversified universe, annual rebalancing is the better default. The quarterly frequency in our main study was chosen because position-capped portfolios benefit from more frequent rebalancing to maintain target diversification.
Universe deep-dives
Tech: The optimizer ignored NVDA
The final optimized weights for the Tech universe tell a counterintuitive story:
| Ticker | Weight |
|---|---|
| PLTR | 20.0% |
| GOOGL | 20.0% |
| CSCO | 20.0% |
| SNOW | 17.7% |
| INTC | 8.0% |
| ORCL | 7.2% |
| AVGO | 4.4% |
| IBM | 2.7% |
Where is NVDA? Nowhere. Where are AAPL, MSFT, META, and AMZN? Also nowhere.
This is MPT working exactly as designed. NVDA had the highest absolute returns in the universe, but it also carried massive volatility. The optimizer penalizes that. PLTR, GOOGL, and CSCO offered better risk-adjusted return profiles and — critically — lower correlation with each other. The optimizer found that combining these stocks produced a portfolio with a 0.86 Sharpe ratio and a 26.4% CAGR.
The trade-off? When the 2022 bear market hit, Tech MPT lost -33.1% with a max drawdown of -38.1% — the worst of any universe. High returns come with high drawdowns, even when optimized.
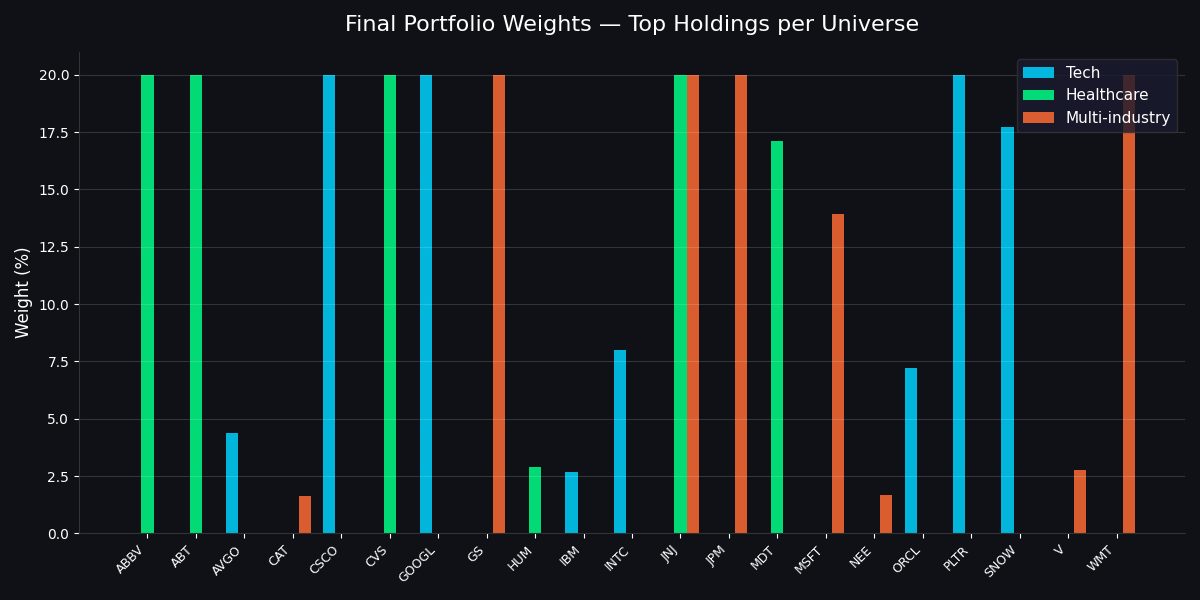
Optimized portfolio weights across all three universes
Healthcare: Defensive, but no alpha
| Ticker | Weight |
|---|---|
| JNJ | 20.0% |
| ABBV | 20.0% |
| ABT | 20.0% |
| CVS | 20.0% |
| MDT | 17.1% |
| HUM | 2.9% |
Healthcare concentrated into six names — JNJ, ABBV, ABT, CVS, MDT, and HUM — all known for stable cash flows and dividend reliability. The optimizer maxed out four positions at the 20% cap.
The result: 11.9% CAGR with 18.3% volatility and a Sharpe of 0.43. That matches SPY's return (also 11.9%) with slightly more volatility. Healthcare MPT slightly trails SPY on risk-adjusted terms (Sharpe 0.43 vs 0.46).
The one advantage: crisis protection. During 2022, Healthcare lost only -2.9% (max drawdown -17.8%) while SPY dropped -19.5% (max drawdown -25.4%). During COVID, Healthcare returned +3.2% while SPY returned -9.7%. If you value capital preservation during crises, Healthcare MPT delivers. But do not expect it to generate meaningful alpha.
Multi-industry: The Sharpe champion
| Ticker | Weight |
|---|---|
| JPM | 20.0% |
| GS | 20.0% |
| WMT | 20.0% |
| JNJ | 20.0% |
| MSFT | 13.9% |
| V | 2.8% |
| NEE | 1.7% |
| CAT | 1.6% |
This is where diversification across sectors actually pays off. The optimizer selected eight stocks spanning finance (JPM, GS), consumer (WMT), healthcare (JNJ), tech (MSFT), payments (V), utilities (NEE), and industrials (CAT). Four positions hit the 20% cap.
Multi-industry delivered a 0.50 Sharpe ratio with 12.5% CAGR and 17.0% volatility — the lowest vol of any universe. It beat SPY on risk-adjusted terms (Sharpe 0.50 vs 0.46) while having a shallower max drawdown (-31.8% vs -34.1%). During the 2022 bear, Multi-industry lost only -1.8% while SPY dropped -19.5%. That is MPT working as designed: optimizing the trade-off, not maximizing one dimension.
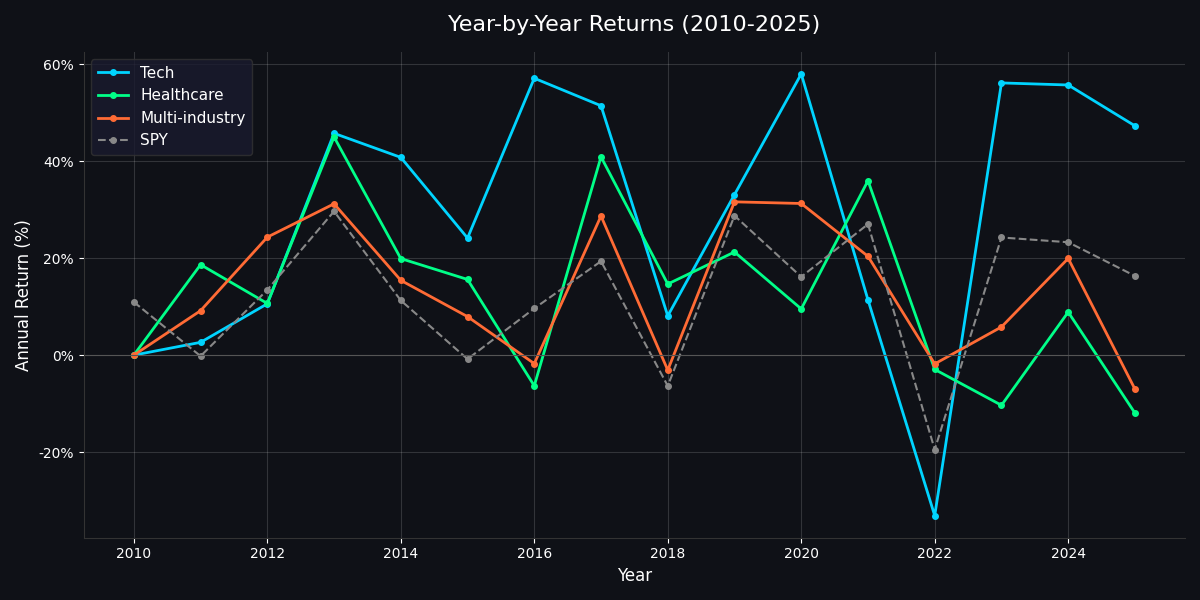
Year-by-year returns for each MPT portfolio vs. SPY
The surprising findings
1. Tech MPT delivered 26.4% CAGR — more than double SPY. The combination of PLTR, GOOGL, CSCO, and SNOW — not the usual FAANG lineup — produced the highest Sharpe (0.86) of any universe. The optimizer consistently favors stocks with favorable risk-adjusted profiles over pure momentum plays.
2. Healthcare barely matched SPY despite lower correlation. With a Sharpe of 0.43 vs SPY's 0.46, the healthcare sector just did not offer enough return dispersion for the optimizer to find alpha. Lower volatility during crises, yes. Better risk-adjusted returns overall, no.
3. Multi-industry had the lowest volatility, not the highest CAGR. This is the fundamental lesson of MPT. The "best" portfolio is not the one that made the most money. Multi-industry returned 12.5% (vs Tech's 26.4%) but did it with 17.0% volatility — the lowest of any universe — and the shallowest drawdown (-31.8%).
4. The optimizer consistently ignores "obvious" picks. No AAPL in Tech. No UNH in Healthcare. NVDA appears in neither. MPT does not care about narratives. It cares about the covariance matrix.
What this means for your portfolio
MPT is not about picking winners. It is about finding the combination that survives all market conditions with the best risk-adjusted return.
The data shows three clear lessons:
- Single-sector concentration is penalized. Even with the best sector in the market (Tech), you take on dramatically more drawdown risk. The 2022 bear hit Tech MPT for -38.1%.
- Diversification is rewarded — but only mathematical diversification. Randomly spreading across sectors is not the same as optimizing weights based on covariance. The Multi-industry portfolio held 8 stocks across 6 sectors and achieved the lowest volatility and drawdown because those stocks were selected for low correlation.
- The "boring" stocks win. JNJ, WMT, CSCO, JPM — these are not the stocks that dominate headlines. But they are the stocks that the math selects when you optimize for risk-adjusted return.
Run this yourself with EvidInvest MCP
Every number in this study was generated using tools available through the EvidInvest MCP server. You can replicate — or extend — this analysis yourself using Claude Desktop.
Here is the workflow:
# Connect EvidInvest MCP to Claude Desktop, then:

# Step 1: Get price history with volatility for each stock
get_price_history_with_volatility("AAPL", "2010-01-01", "2025-12-31")
get_price_history_with_volatility("MSFT", "2010-01-01", "2025-12-31")
# ... repeat for each symbol in your universe

# Step 2: Run the optimizer
get_mpt_optimization(["AAPL", "MSFT", "NVDA", "GOOGL"], lookback_days=252)

# Step 3: Analyze risk metrics
get_sharpe_ratio("AAPL", lookback_days=252)
The get_price_history_with_volatility tool returns not just raw prices, but also derived 30-day and 90-day rolling volatility — exactly what the optimizer needs. This is data you would normally have to compute yourself from raw price series using pandas or numpy.
The get_mpt_optimization tool runs the same Max Sharpe optimization we used in this study: scipy SLSQP solver, configurable lookback, position limits, and long-only constraints. It returns the optimal weight vector, expected return, expected volatility, and the Sharpe ratio — all in one call.
Want to test a different universe? Swap in your own tickers. Want a different lookback window? Change lookback_days. The tools handle the covariance estimation, optimization, and risk decomposition. You focus on the investment thesis.
EvidInvest MCP is available to Pro subscribers. Connect it to Claude Desktop in 2 minutes → evidinvest.com/developers
Try the portfolio optimizer yourself → evidinvest.com/portfolio
Fair Value Weekly
Get DCF breakdowns, fair value updates, and portfolio ideas for serious investors. No spam, no paywalled teasers.